
Introduction
Creating high-performing and efficient apps requires optimizing memory utilization in the present software development environment. Memory profiling is an efficient technique for accomplishing this. Memory profiling examines a program’s memory usage and finds memory-intensive code segments, possible memory leaks, and optimization possibilities. This procedure aids programmers in making sure their apps utilize memory effectively, resulting in quicker and more scalable processes. This article is an introductory guide for memory profiling in Python.
What is Memory Profiling?
Memory profiling is the technique of examining software to determine how much memory it utilizes. It helps identify memory-intensive code segments, potential memory leaks, and potential optimization targets. By profiling memory, developers may ensure that their applications use memory efficiently and achieve faster and more scalable operations.
Importance of Memory Profiling
- Performance Improvement: Developers can enhance an application’s speed and responsiveness by identifying memory-intensive tasks and optimizing the code.
- Resource Management: When memory is used efficiently, applications become more robust and scalable, lessening the strain on system resources.
- Debugging Memory Leaks: Memory leaks, which can eventually cause crashes or sluggish performance, can be found and fixed using memory profiling.
Advantages of Memory Profiling in Python
- Identifying Bottlenecks: Memory profiling aids in locating code segments that use excessive amounts of memory. Thus, allowing programmers to modify such sections for increased efficiency.
- Leak Detection: Memory profiling tools can identify memory leaks, which happen when memory no longer required is kept in reserve. Hence eventually increasing memory utilization.
- Predictable Behavior: Memory profiling contributes to steady memory utilization, stabilizing and producing more predictable application behavior.
- Long-term Reliability: Continuous memory profiling can ensure that long-running applications remain reliable and efficient over time.
- Code Refactoring: Profiling can highlight inefficient code. Therefore, prompting developers to refactor and improve the overall code quality.
Disadvantages of Memory Profiling in Python
- Increased Runtime: Memory profiling may cause the application to execute with additional overhead. Therefore, resulting in a slower profile during the profiling process.
- Code Modification: Some profiling tools require adding decorators or certain function calls to the code. Thus, it can be invasive and impact the codebase.
- Limited Scope: Some memory profiling tools may provide only a partial view of memory usage, potentially missing issues that manifest under specific conditions or workloads.
- Snapshot Limitations: Tools that rely on snapshots might not capture transient memory usage spikes, leading to incomplete analysis.
- Inaccurate Reports: Profiling tools might sometimes report false positives or negatives, especially in complex applications, leading to misdirected optimization efforts.
Several tools are available for Python memory profiling, each with unique capabilities and applications. We look at a few of the more well-known ones here.
1. memory_profiler
One common tool for tracking memory consumption is memory_profiler. It provides line-by-line information on memory use. Thus simplifying the identification of memory-intensive portions of the code.
Features
- Line-by-Line Analysis: Allows detailed inspection of memory usage at each line of code.
- Ease of Use: Simple to integrate with Python code using decorators.
- Integration with IPython: This can be used with IPython for interactive profiling.
Installation
pip install memory-profilerUsage
To use memory_profiler, decorate the function you want to profile with @profile And run the script with the -m memory_profiler Flag.
from memory_profiler import profile

@profile
def my_function():
a = [1] * (10**6)
b = [2] * (2 * 10**7)
del b
return a

if __name__ == "__main__":
my_function()
Output
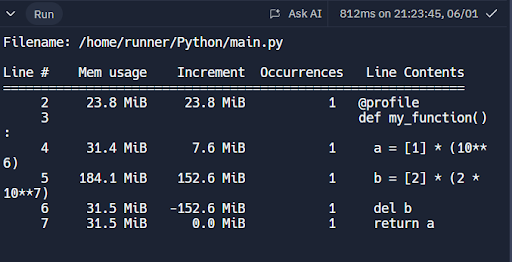
Running this script will produce a detailed memory usage report for each line in the decorated function.
2. guppy3
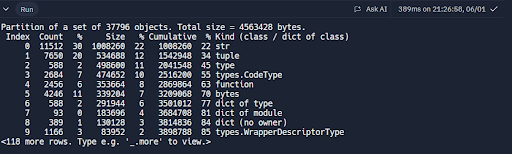
guppy3 is a comprehensive Python programming environment with a heap analysis toolset. It includes a heap analysis tool for finding memory leaks and analyzing memory usage.
Features
- Heap Analysis: Detailed heap usage reports and analysis.
- Debugging Memory Leaks: Effective in identifying memory leaks.
- Interactive Use: This can be used interactively for in-depth analysis.
Installation
pip install guppy3Usage
from guppy import hpy

hp = hpy()
heap = hp.heap()
print(heap)
Output
3. tracemalloc
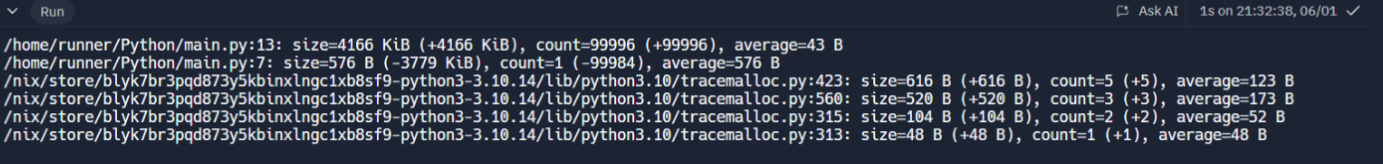
tracemalloc is a built-in module in Python that tracks memory allocations. It provides statistical memory usage analysis. Additionally, it can be useful for tracking memory leaks.
Features
- Built-in: No need for additional installations.
- Snapshot Comparison: Compare memory usage snapshots to identify changes.
- Detailed Reports: Provides detailed reports on memory allocation.
Usage
import tracemalloc

tracemalloc.start()

# Your code here (replace with actual code whose memory usage you want to monitor)
# For example, creating a large list:
data = [x ** 2 for x in range(100000)]

snapshot1 = tracemalloc.take_snapshot()

# Your code here (replace with actual code whose memory usage you want to monitor)
# For example, modifying the list:
data = [x ** 3 for x in range(100000)]


snapshot2 = tracemalloc.take_snapshot()

top_stats = snapshot2.compare_to(snapshot1, 'lineno')

for stat in top_stats[:10]:
print(stat)
Output
4. objgraph
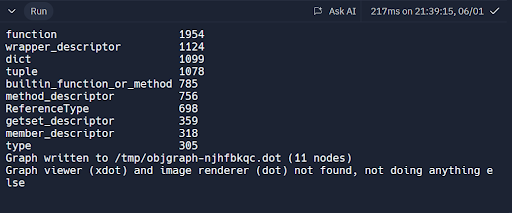
objgraph is a module that lets you visually explore Python object graphs. It can help find memory leaks by identifying objects that are taking up memory. Furthermore, it can help in tracking down why they are not being garbage collected.
Features
- Visual Representation: Generates visual representations of object graphs.
- Finding Leaks: Helps identify objects that are causing memory leaks.
- Interactive: Using it interactively to explore object relationships.
Installation
pip install objgraphUsage
import objgraph

# Your code here
# For example,
#  Define a sample class
class MyClass:
    def __init__(self, value):
        self.value = value

# Create instances of the class
obj1 = MyClass(10)
obj2 = MyClass(20)
obj3 = MyClass(30)

# Assign one of the objects to a variable for inspection
some_object = obj1


objgraph.show_most_common_types()
objgraph.show_backrefs([some_object], max_depth=10)
Output
5. pympler
pympler is another powerful tool for tracking memory usage in Python programs. It provides detailed reports, and moreover, it can help analyze the lifetime of Python objects.
Features
- Comprehensive Reports: Provides detailed memory usage reports.
- Tracking Object Lifetimes: Tracks the lifetime of Python objects.
- Integrates with Existing Code: This can be integrated for continuous monitoring.
Installation
pip install pymplerUsage
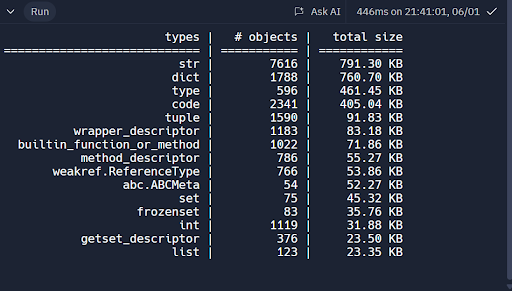
from pympler import summary, muppy

all_objects = muppy.get_objects()
sum1 = summary.summarize(all_objects)
summary.print_(sum1)
Output
Best Practices for Memory Profiling
- Profile Regularly: Integrate memory profiling into your development workflow to catch memory issues early.
- Optimize Data Structures: Choose the right data structures that balance memory usage and performance.
- Monitor Long-Running Applications: Continuously monitor memory usage in applications that run for extended periods.
- Use Memory Pools: Implement memory pools to manage memory allocation and deallocation efficiently.
Also Read: Generate Reports Using Pandas Profiling
Conclusion
Therefore, memory profiling is essential for developing efficient and robust Python applications. By using tools like memory_profiler, guppy3, tracemalloc, objgraph, and pympler, developers can learn about their applications’ memory consumption patterns and adjust them accordingly. Frequent memory profiling enhances efficiency, guards against memory leaks, and guarantees that apps function properly.
If you want to learn more about Python, do Analytics Vidhya’s Python course.